Manufacturers
Profitable on Paper, Cash Poor in Reality?
Stop making the right decisions based on the wrong information.
Your reports aren't lying. They're just not showing you everything.
Cash feels tight. You can't understand why.
Profits go up. Cash doesn't follow.
Expenses are cut. Profits don't improve.
Why This Happens
It’s not a cash flow problem. It’s a visibility problem.

See Where Your Cash is Trapped
The Kaufmann Quickscan is an AI-powered diagnostic tool that shows you where cash gets trapped in your operations and how much hidden profit you can uncover.
It’s not another consultant-led assessment or endless questionnaire. It’s built for people who want answers on their own time and don’t need someone looking over their shoulder.
You can explore patterns in your business whenever it suits you — during a quiet hour, after meetings, or between tasks — without needing to share your data with anyone.
Start with the Discovery Section. Choose an operational category, highlight where challenges exist, and Quickscan will map patterns that show where cash is being trapped.
You can save your progress and come back anytime. No charge. Ever.
When you’re ready to see the numbers, move to the Assessment Section. That’s where the tool calculates your potential financial impact — a dollar-based view of your hidden profit.
There’s a modest fee for the Assessment Section, but it gives you full control to test scenarios, adjust inputs, and instantly see how changes affect your bottom line.
Save your work. Come back anytime and revise. One fee. Yours forever.
You get
- Clarity on the patterns that are trapping your cash in assets
- The financial impact on your business
- An Impact Matrix to help you prioritize fixes
- No meetings
- No waiting on a consultant’s report
- Insights you can use right away – on your schedule, not anyone else’s.
Case Studies
Case Study #1: They Wrote Off $250K. We Found $300K.

The furniture retailer’s inventory report showed $250K in “defective” merchandise.
The reality: only about 20% was truly defective. The rest was either fine, missing a part, or needed a small repair.
The problem: the system had just one code for damaged items—“D” for defective. On the report, a ruined couch looked exactly the same as one that just needed a leg.
The solution: three new codes—G for good, P for parts, R for repair.
Good items went straight back into inventory for resale.
Parts and repair items were fixed and went back into inventory to sell.
Now the owner had a report with real visibility: value of inventory and actual status.
That’s how $250,000 of “defective” inventory became $300,000 in profitable sales.
Case Study #2: The Customers Who Already Paid

The industrial fastener manufacturer’s receivables aging showed $300K more than 90 days past due. The CFO was certain customers hadn’t paid.
But they had. Cash was sitting in a suspense account, unmatched to invoices.
The CFO was only looking at the AR aging. That report only gives partial visibility.
We pulled three numbers for the same date:
The total on the AR aging.
The AR balance in the trial balance
The AR line on the balance sheet
Those didn’t tie. That was the clue this wasn’t a collections problem at all.
Once we followed the trail, hundreds of thousands were recovered from accounts that were never actually past due.
Symptoms Are Clues, Not Distractions
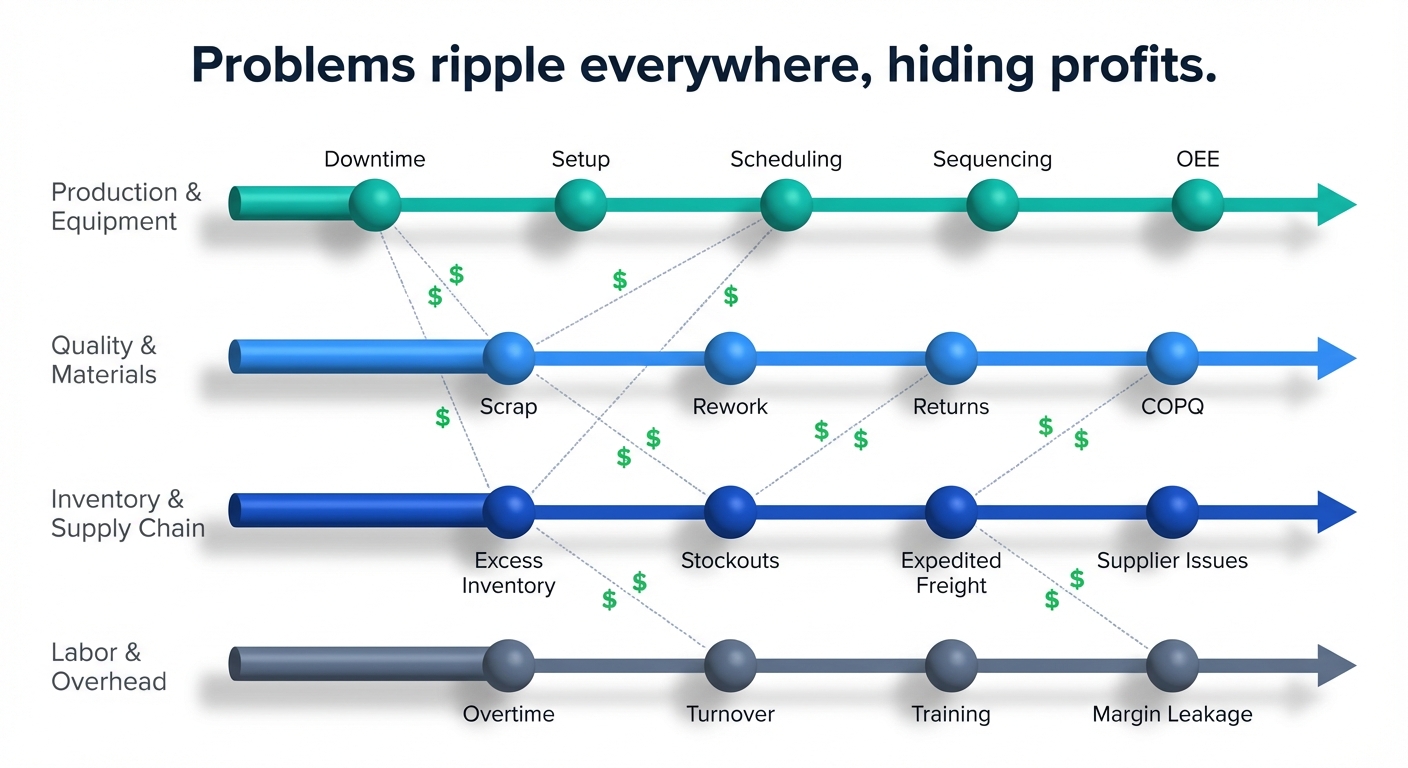
Overtime. Expedites. Rework. Inventory orders that “had to happen this week.”
These are not random problems. They’re clues to connected patterns hiding your profit.
You only see one or two at a time, so you treat them as isolated. They’re not.
So don’t ask: “What’s the real problem behind this symptom?”
Instead, ask: “What pattern of events keeps creating this symptom?”
Where We Focus
Accelerator
Specialist
Implementer
Consulting
Focus On
Look
Assume
Measure
What's Next?

This isn’t about getting more profit through increased sales or reduced expenses. You’ve already earned the profit. You just can’t see it.
Pick a symptom. We identify what else it’s triggering. You see the hidden profit buried in that pattern — and what it would take in new sales to recover the same money.
Increase visibility, not sales.
Why I See What Others Miss

I’m a finance guy who likes living in the ops world.
I’ve sat inside companies as controller and operations manager — close to the floor, close to the numbers. And I’ve sat outside as a banker and consultant — seeing what the reports don’t say.
That dual view is how I find patterns others miss.
If your current data told the whole story, you’d already know where your money went.
Let’s discuss working together to see where your profit is hiding.